
Control Performance Coefficient: A key control selection criterion
By Mikhail Ben Rabah, CIA, CRMA, CFE
Government Audit Manager, Presidency of the Government, Tunisia
Selecting a control as a risk response is not an easy task for most organizations. Balancing control costs and benefits is a thorough exercise and a critical success factor of risk management. In a context of increasing volatile risks and unsteady corporate resilience, organizations have to be knowledgeable about how to evaluate control performance and master it. The Control Performance Coefficient may be a useful tool.
- Residual risk and cost of control.
While selecting the most appropriate risk response, organizations should consider, among other factors, costs and benefits of controls. They should be proportionate to the risk severity and its priority. So, in the case of a downside risk, the cost of control supposed to address the risk should be balanced with the benefit of risk reduction.
However, a clarification has to be made about this equation. I have been seeing in many risk management manuals that residual risk (the risk that remains after risk responses are executed) should align with the risk appetite (the level of risk the organization is willing to accept) and the target residual profile defined by the organization. This lacks accuracy. Since everything has a cost and therefore should somehow be budgeted, this equation is better expressed as follows: The sum of expected loss after risk response (residual risk) and the cost of control (risk response) should be within the acceptable expected loss which corresponds to the acceptable level of risk (risk appetite). Even when risks are qualitatively assessed and measured, this reasoning remains valid. Similarly, when addressing upside risks (opportunities) the cost of risk exploring or pursuing should be added to the expected benefit or gain of risk taking while determining the acceptable level of benefit/gain.
Below is a simple illustration.
Assume that an organization is willing to mitigate (reduce) an inherent risk (which severity is measured in terms of likelihood and impact) in a given period of 50 USD to an acceptable level of risk of 25 USD. The residual risk targeted by the organization is 15 USD. That means the cost of the control (cost of control design, implementation, test, etc.) selected by the organization to address this risk should not exceed 10 USD.
However, the cost of control is not the only critical criteria that organizations should consider when selecting the most appropriate control. Control performance is a key factor. First of all, there must be a clear understanding of adequacy, effectiveness and efficiency of controls which are distinct concepts although interconnected. While adequacy of a control refers mainly to its design and ability to reduce risk, control effectiveness considers if the implemented control achieves the purpose for which it was designed, as well as if it is consistently and correctly applied, and remains effective throughout the period. Often, auditors use to evaluate first the design adequacy of controls to help determine whether it may be appropriate to test controls for effectiveness.
Adequacy of controls refers to their design, a design that ensures that they are appropriate and good enough to assist the organization in its quest to achieve its objectives. Controls are adequate if they reduce either the likelihood or the impact of a negative event happening, or both. Adequacy of controls is an important factor in the selection process. Often, organizations have to choose among a variety of control activities to address a given risk. Furthermore, the cost of a control is not a single amount. It varies depending on its design and how much the organization is willing to invest. For example, the cost of implementing a video surveillance system as a physical access control to a data center would depend on the number of cameras installed, the monitoring software, the number of personnel assigned to surveillance, etc. Adequacy of the control is often directly related to its cost. Evaluating the efficiency of controls, typically implies determining whether management measures and monitors the costs and benefits of controls. For convenience, in this paper we refer to control performance as a combination of adequacy, effectiveness and efficiency. In other words, any given impact of a control on risk reduction whether due to its design, application or cost is part of its performance.
The Assessment of the performance of a given control could be conducted through a basic concept: The Control Performance Coefficient (CPC).
- The Control Performance Coefficient (CPC).
The performance of a given control is measured in terms of risk reduction. In other terms how much the dollar amount the organization invested in the control contributes to the reduction of the expected loss. In the above example, the performance of the selected control is 35 USD (50 – 15). However, the performance of a control is not static and varies depending of the amount invested in the control (cost). The organization has to know how much the expected loss (residual risk) would be if it invested more or less than 10 USD in the control. Thus, the organization should know, even approximatively, the contribution of each additional dollar invested to the reduction of risk. The formula is the following:
∆ (CC) = r x ∆ (R) where:
CC refers to the cost of control (cost of design, implementation, test, monitoring, etc.) and ∆ (CC) to variation of control cost;
∆ (R) refers to the variation of the expected loss due to the risk response;
r refers to correlation coefficient between two variables (control cost and risk reduction)
Clarifications should be provided about this formula:
- The correlation between the control cost and risk reduction is not linear (r is not equal to 1 or -1); in other words, not each additional dollar invested in the control will lead to the same amount of expected loss reduction.
- The increasing performance of the control is not infinite. There should be a limit above which the performance of the control becomes constant and each additional dollar amount invested in the control has no effect on the performance.
- Although a high correlation coefficient does not prove a cause-effect relationship between variables, it demonstrates at least that variables are somewhat connected and tend to behave in a predicted manner;
- The assessment of the control performance through measuring correlation between cost and risk reduction is not an easy task. It’s often and better delivered through benchmarking similar controls in comparable processes or organizations.
The CEC is deemed important in so far as it assists organizations in the selecting process of controls. The case study below helps understanding how.
- Case study.
Assume an organization is willing to reduce an inherent risk of 50 USD expected loss during a given period to an acceptable level of 25 USD and has to select a control among three identified ones (C1, C2 and C3). The table below provides data about the three controls.
| Control cost
USD |
Risk reduction if C1 is selected USD | Residual1 risk (RR) USD | Total cost (control cost + RR) USD | Risk reduction if C2 is selected USD | Residual risk (RR) USD | Total cost (control cost + RR) USD | Risk reduction if C3 is selected USD | Residual risk (RR) USD | Total cost (control cost + RR) USD |
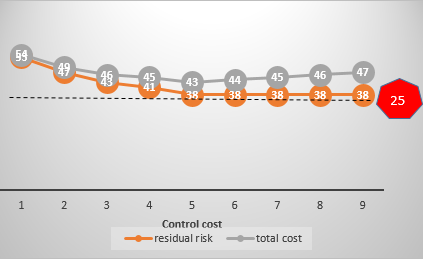
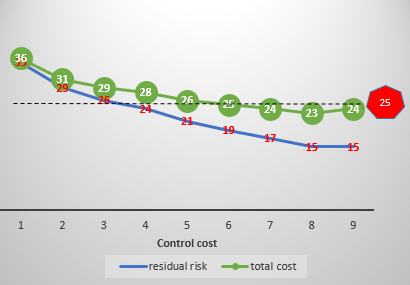
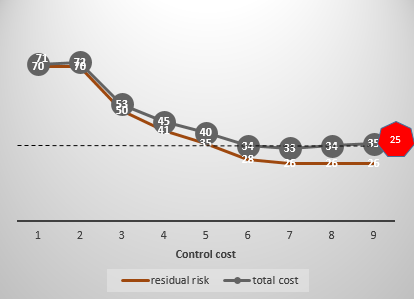
| 1 | 17 | 33 | 34 | 15 | 35 | 36 | 0 | 50 | 51 |
| 2 | 23 | 27 | 29 | 21 | 29 | 31 | 0 | 50 | 52 |
| 3 | 27 | 23 | 26 | 24 | 26 | 29 | 20 | 30 | 33 |
| 4 | 29 | 21 | 25 | 26 | 24 | 28 | 29 | 21 | 25 |
| 5 | 32 | 18 | 23 | 29 | 21 | 26 | 35 | 15 | 20 |
| 6 | 32 | 18 | 24 | 31 | 19 | 25 | 42 | 8 | 14 |
| 7 | 32 | 18 | 25 | 33 | 17 | 24 | 44 | 6 | 13 |
| 8 | 32 | 18 | 26 | 35 | 15 | 23 | 44 | 6 | 14 |
| 9 | 32 | 18 | 27 | 35 | 15 | 24 | 44 | 6 | 15 |
1 RR = 50 – Risk reduction
r1 : the correlation coefficient between cost of C1 and variation of risk is 0.85
r2 : the correlation coefficient between cost of C2 and variation of risk is 0.97
r3 : the correlation coefficient between cost of C3 and variation of risk is 0.92
Correlation coefficients of each of the three controls are above 0.5 which demonstrate a high correlation between the controls and the risk reduction. Data about control C2 shows a more linear relationship between each additional dollar invested and the risk reduction (the highest correlation coefficient). Thus, effect of C2 is the most predictable and manageable. However, it’s the costliest since the organization should invest 6 USD to reach the acceptable level of risk against 4 USD for C1 or C2. So if the organization wishes a “control under control”, it may bear some additional cost and opt for C2.
Conclusion 1: to be considered effective, a high correlation should be demonstrated between the cost invested and the risk reduction.
To reach the targeted acceptable level of risk (25), three scenarios are possible:
- Implement C1 with a cost of 4 USD;
- Implement C2 with a cost of 6 USD;
- Implement C3 with a cost of 4 USD.
In a stable and unchanging environment, the organization would select C1 or C2 and invest 4 USD, the minimum possible cost required to lower risk level to the targeted value.
However, in the fast-evolving today’s business environment, risks are getting more volatile. Their impact or likelihood are not supposed to be constant over time. Furthermore, organizations’ vulnerabilities to risk exposure and risk appetite can evolve rapidly especially if they rely on ever-changing technology. Thus, assume the following scenarios:
- Scenario 1: The organization reviewed its risk appetite and decides not to accept an expected loss above 20 USD. That would not be possible if the organization opted for implementing C1 or C2 since the lowest expected loss driven by those controls is 23 USD. In this case, the organization has to abandon the current control and invest in another one (C3). Thus, if the organization is anticipating change in its risk appetite (by taking less risk in the future), implementing C3 would be the best choice from the beginning.
- Scenario 2: The organization is updating the risk assessment. The updated inherent risk severity is 70 USD instead of 50 USD. The risk appetite is maintained at 25 USD. In this case, C1 and C2 would be ineffective since whatever the level chosen, the expected loss will far exceed the targeted value. Only C3 if implemented can lower the expected loss to the desired level (70-46 =26).
Conclusion 2: Organizations may consider control performance coefficient in the selection process while expecting changes in the risk severity, their vulnerability to risk exposure or their risk appetite.
versatility within a broad skill set. As an active member of the Institute of Internal Auditors (Global Guidance Contributor) and the Association of Certified Fraud Examiners (Member of the ACFE Advisory Council), I take pride in contributing to the progress of the audit and anti-fraud professions.
- Shall internal auditors be prepared to “Metaverse”? - November 6, 2021
- Overzealousness, a Threat to Auditors’ Objectivity? - January 19, 2021
- How Worthy Time Management is in Internal Auditing - December 28, 2020
Stay connected